Most video hosting services provide customers with data, but marketers shouldn’t stop there. Columnist Brian Massey explains how to combine this information with website analytics.

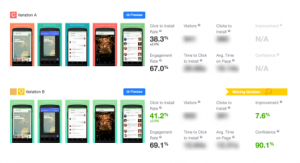
We recently completed a test for a company that sells a software application. Our test showed that we could increase demos of the software by 29% with one change.
What was the change?
We removed a video from the demo request page. We decided to test this because a look at the analytics told us few visitors were watching the video. Thus, we thought it was in the way of more important information — information that could get more visitors to complete the form on the page.
Video is just one example of an ever-growing list of third-party services that are being integrated into websites. Your site may incorporate live chat, ratings and reviews, exit-intent overlays, faceted search or personalized recommendations services provided by a third party.
Most of these will offer a dashboard of analytics to help you evaluate their impact on your visitors. These “In App” analytics can provide deep insight into your visitors’ behavior.
However, these data are not sufficient to see the impact of these tools on leads and sales. For this, we need to integrate data from these tools into our primary analytics platforms, such as Google Analytics.
The Power Marketer will use both in-app and integrated data when identifying opportunities to optimize. In this column, we’ll explore integration of third-party analytics with Google Analytics to help us answer thorny questions about our website investments.
In-App Analytics
Most third-party tools are going to provide helpful analytics. For example, take the world of video hosts. These services will host your videos and provide ways to embed video players on your site. They promise faster, more reliable streaming than your basic Web servers could provide.
We have used YouTube, Vimeo, Ooyala, Wistia and Vidyard in our video-related projects. YouTube is free, but offers too many opportunities for our visitors to leave the site. The others require a monthly fee to host video.
Each of these services offers basic in-app analytics through their dashboards:
- Number of times a video is loaded
- Number of times a video is played
- Percentage of visitors who clicked Play
- Average percentage of video watched
- The countries from which videos are viewed
The graph below, from Vimeo, shows how many visitors saw the video, how many watched and how many shared it.

Here is a report from Wistia for an eight-part video series we used to generate this data. It was interesting that viewers didn’t watch the eight videos in order. We can deduce which topics were of more interest to visitors from this report.

Vidyard and YouTube have a very helpful graph that shows viewer drop-off throughout a video. You can use this to see which part of your video is least interesting to visitors, and estimate how many stick around for the whole thing.

The insights from these in-app analytics can be quite revealing. Below is an audience retention graph from a YouTube account. You can get this graphic, synchronized with the associated video, right inside your YouTube channel.
Notice the sharp drop-off in viewer engagement at the beginning of the graph, the first seconds of the video? What would cause this?

Our hypothesis was that viewers lost interest due to a vanity logo sequence.

To support our hypothesis, we chose another video by this company that didn’t have the vanity intro. There’s a much smaller initial drop in attention at the beginning of this video.

Vanity, thy name is logo. Even we here at Conversion Sciences have given in to our egos…

…with similarly unpleasant results.

Needless to say, we’ve stopped using the cool branding sequence in our videos.
Integrated Analytics
The problem with in-app analytics is that we can’t link their metrics with our bottom-line metrics: leads and sales. Attention or Engagement metrics are predictive. They tell us what might happen. They are not definitive. As we’ve written before, increasing engagement may actually decrease conversion.
We want to know the answer to questions like these:
- Do visitors who view our video buy more often?
- Are they more likely to complete a lead form?
- Do they buy more or less?
- How does their buying behavior change if they only watch part of a video?
- Which videos seem to generate more sales?
To answer these questions, we need to bring our third-party data into Google Analytics.
Fortunately, most third-party applications provide a method for creating Google Analytics events when visitors interact with them: when they watch a video, request a live chat or complete a faceted search.
The provider will let you enter your Google Analytics ID number or will provide some JavaScript that is added to the page.
Dealing With What They Give Us
In most cases, these third-party applications will write Events to Google Analytics. In the case of our video hosts, they set events when the video is played, when it is completed, and when the viewer watches certain portions.
This means we don’t have much control over what they provide. Nonetheless, they are generally sufficient for us to create some advanced segments and see how their service is affecting our bottom line.
We tested both Wistia and Vidyard on our eight-part video mini-course. See the Wistia version here and the Vidyard version here.
We see the events generated by these to embedded players using the Events menu in Google Analytics.

For each, we get Events that tell us if a video was played, and how much was watched.

They will even tell us which videos are being viewed.

This information is available through their dashboards. What is more interesting is when we create an Advanced Segment that isolates sessions in which the visitor played a video.
We used Wistia’s Play event to isolate sessions in which any of the eight videos was played.

For an e-commerce site, we can identify visitors who watched one or more videos and determine if the video impacted their buying habits.

These data (if they were real) would indicate that visitors who played a video are less likely to buy, and buy less with their purchase.
What insights will you find in your integrated analytics? Which third-party apps feed your business and which leach sales from you? The data can all be there for you.
Here are some implementation details for setting up integrated analytics.
Setting Up Wistia
Set up Wistia by going here and/or here.
Setting Up Vidyard
Set up Vidyard here.
Setting Up YouTube
Set up YouTube here.
(Thanks to VidPow for producing the video used in portions of this column.)
Listen to the Column
Marketing Land – Internet Marketing News, Strategies & Tips
(392)
Report Post


